What is stress strain curve? A stress strain curve is a graphical representation in material science that illustrates the relationship between stress (applied force per unit area) and strain (resulting deformation). Engineers analyze this curve to determine critical mechanical properties, including elasticity, yield strength, and ultimate tensile strength.
Understanding how materials behave under mechanical load is fundamental for safe structural design and accurate failure prediction. Whether analyzing ductile metals or brittle ceramics, interpreting these parameters is essential for both academic study and professional engineering applications.
在此 CAE 助手 guide we provide a rigorous breakdown of the curve’s essential components. We will examine the transition from reversible elastic behavior governed by Hooke’s Law to permanent plastic deformation, explore key metrics like Young’s modulus, and apply these concepts to real-world material selection. By the end, you will be equipped to confidently interpret stress-strain data for any engineering project.
$$\sigma = E\epsilon$$
What is the Stress Strain Curve?
应力-应变曲线描述了材料在受力时应力(单位面积上的力)与应变(形变)之间的关系。该曲线有两个主要轴:纵轴表示应力,横轴表示应变。这条曲线对于理解材料行为至关重要,是工程设计中的关键工具,尤其是在为特定应用选择材料时。.
通过分析应力-应变曲线,工程师可以预测材料的性能,并确定其在各种环境下的适用性,从而确保安全性和功能性。图1所示为低碳钢的典型应力-应变曲线示意图。.
📍 stress strain diagram:
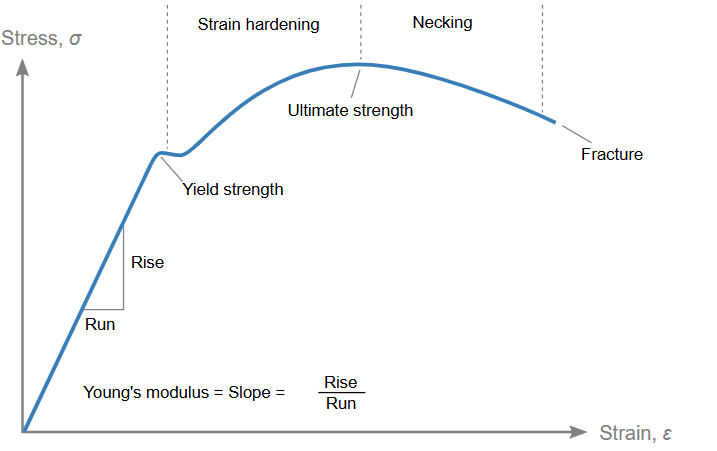
图 1:低碳钢的应力-应变曲线 [参考]
stress-strain curve for different materials
| 材料 | Young’s Modulus (GPa) | Yield Stress (MPa) | Yield Strain | Ultimate Stress (MPa) | Ultimate Strain |
|---|---|---|---|---|---|
| Structural Steel (ASTM A36) | 200 | 250 | 0.0012 | 400 – 550 | 0.20 |
| Stainless Steel 304 | 193 | 215 | 0.0011 | 505 | 0.70 |
| Stainless Steel 316 | 193 | 205 | 0.0011 | 515 | 0.60 |
| Aluminum Alloy (6061-T6) | 68.9 | 276 | 0.0040 | 310 | 0.12 |
| Titanium Alloy (Ti-6Al-4V) | 114 | 880 | 0.0077 | 950 | 0.14 |
| Copper (Pure Annealed) | 117 | 70 | 0.0006 | 220 | 0.45 |
| 碳纤维(CFRP) | 200 | N/A (Brittle) | 不适用 | 3500+ | 0.015 |
| High-Density Polyethylene (HDPE) | 0.8 | 26 | 0.0300 | 33 | 5.00+ |
| ABS (Acrylonitrile Butadiene) | 2.1 | 40 | 0.0180 | 45 | 0.10 |
| PLA (Polylactic Acid) | 3.5 | 50 | 0.0150 | 60 | 0.06 |
| Structural Concrete (High Strength) | 30 | N/A (Brittle) | 不适用 | 5 (Tension) | 0.001 |
How to Read or Interpret the Stress Strain Curve?
应力-应变曲线提供了丰富的材料性能信息。通过分析曲线的形状和特征,工程师可以推断出各种材料性能,包括强度、弹性、延展性和韧性。以下是一份清晰简洁的指南,帮助您像工程师一样解读应力-应变曲线;别担心!我们将在下文中详细解释每个部分:
 应力-应变曲线解读分步指南

- 理解坐标轴:应力和应变
应力和应变是描述材料在力作用下行为的两个关键概念。.
- 压力 力是指作用在材料单位面积上的力,通常以帕斯卡(Pa)为单位。它表示作用在材料面积上的力的大小。.
- 拉紧 变形量是衡量材料在受力时发生形变的指标。它是一个无量纲量,表示材料在受力后形状或尺寸的变化程度。.
您可以在我们的博客中了解更多关于应力和应变的知识,包括它们的定义以及应力-应变曲线:“平面应力与平面应变:它们是什么以及何时使用“。”.
应力与应变之间的数学关系可以通过各种术语来表达,这些术语取决于物体的几何形状、外部环境以及作用于物体上的力的特性和方向(见图 2)。.
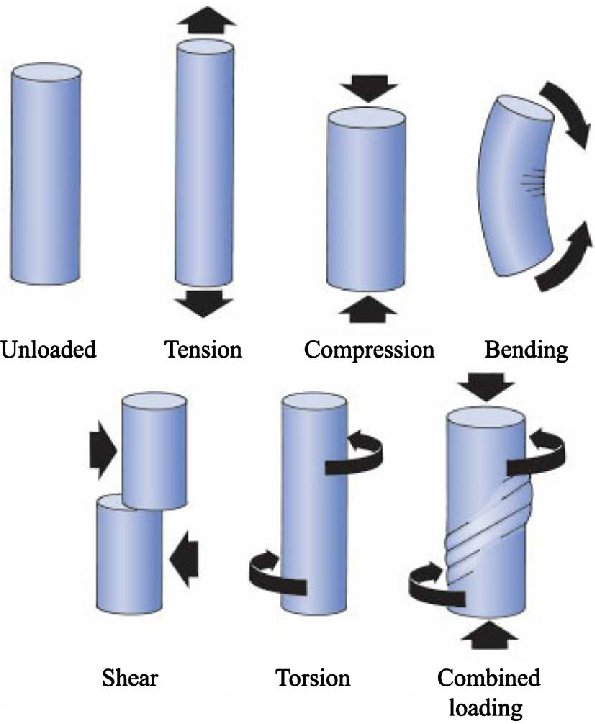
图 2:不同载荷情况的示意图 [参考]
 解读曲线的额外技巧
-
使用 0.2% 偏移法 如果屈服点不明确——这对于具有渐变转变的金属来说是正常的。.
-
真实曲线与工程曲线: 使用 真实应力-应变 适用于金属成形等大变形应用。.
-
材质类型很重要韧性 = 曲线长而弯曲;脆性 = 曲线短而陡峭,并有突然下降。.
-
条件改变曲线高温或加载速度会影响形状和性能。.
What are the key regions of the stress strain curve?
应力-应变曲线上有几个关键区域对于理解材料行为至关重要:
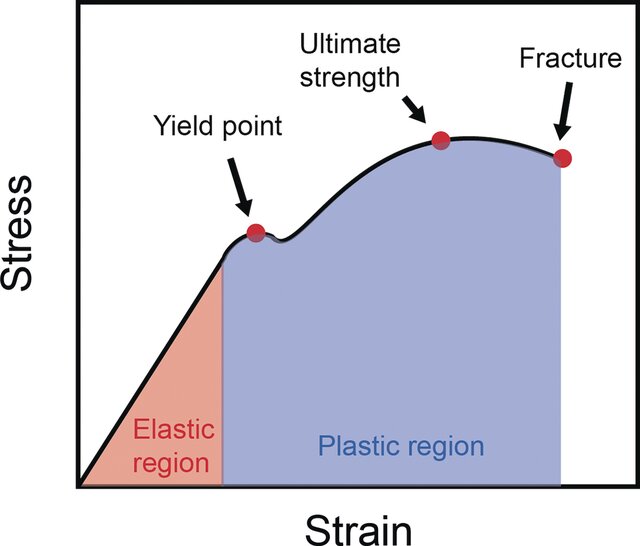
图 3:应力-应变曲线区域 [参考]
- 弹性区域: 在该区域,材料会发生形变,但应力消除后会恢复到原来的形状。应力与应变之间的关系在该区域呈线性关系(见图3)。.
- 塑料区域: 该区域表明材料已发生永久变形。材料仍能承受应变,但卸载后不会恢复到原来的形状(见图3)。.
- 屈服点: 材料从弹性形变过渡到塑性形变的临界点。超过此点后,材料将无法恢复到原始形状,并发生永久形变。该临界点标志着永久形变的开始,理解此值对于确保材料在工程设计中不会发生超出可接受范围的形变至关重要(见图3)。.
- 颈部: 当材料达到其极限抗拉强度时,就会发生颈缩现象,此时应变硬化不再可行。这会导致材料横截面特定区域内发生局部变形,从而导致尺寸减小,而应力则持续上升(见图1)。.
- 极限抗拉强度: 极限抗拉强度(UTS)是指材料在断裂前所能承受的最大应力。它是选择承重材料的重要因素,因为它决定了材料在不发生断裂的情况下所能承受的最大载荷(见图3)。.
- 断裂点: 材料断裂或破裂的点,通常是在发生显著塑性变形之后(见图 3)。.
How Stiff is It? Decoding the Slope of the Stress-Strain Curve | Elastic Region in stress strain curve
应力-应变曲线能够展现材料变形的各个阶段。它显示了材料的初始弹性行为(即应力-应变曲线中的弹性区域,在此区域材料恢复到初始形状),随后是塑性变形(即应力-应变曲线中的塑性区域,在此区域材料发生永久变形),最终是断裂(在此区域材料失效),如图3所示。该曲线对于理解材料在应力作用下的行为至关重要,而这直接影响着工程决策。.
了解 坡 应力-应变曲线——尤其是在 弹性区域——能够深入了解材料的刚度及其在应力作用下的性能。以下是简要说明:
关键弹性特性及其与曲线关系概述


要点总结
-
弹性区域 = 斜率 = 刚度信息
-
仅有的 杨氏模量 可以直接从中看出 正应力-应变曲线
-
其他模量(剪切模量、体积模量) 需要特定的测试条件
-
了解这些数值有助于工程师设计出能够保持强度、刚度或柔韧性的材料——完全符合他们的需求。.
胡克定律:
胡克定律指出,在材料的弹性范围内,施加于材料的应力与其产生的应变成正比。值得一提的是,在应力-应变曲线上,胡克定律仅在弹性区域有效。在该区域,应力-应变关系呈线性,当应力移除后,材料将恢复到其原始形状。杨氏模量、剪切模量、体积模量和其他相关参数均源于胡克定律的原理。 推广胡克定律 .
胡克定律可以用数学方法证明。该领域内应力与应变的恒定比值被定义为杨氏模量。, E, (SI 单位:Pa),也被称为刚度。.
$\sigma = E\epsilon$
In the above equation, $\sigma$ is stress and $\epsilon$ is strain.
杨氏模量:
杨氏模量是材料的基本属性,对于给定的材料而言,其值与其几何形状无关,且为均匀分布。具有结构各向异性的材料的杨氏模量可能会随测量方向而变化。例如,木材沿纹理方向测试的杨氏模量高于垂直于纹理方向测试的杨氏模量。.
剪切模量:
此外,我们还可以定义剪切模量,也称为刚性模量,, G, 具体如下:
其中,, $\tau$ 是剪切应力 $\gamma$ 是剪切应变。.
到目前为止,我们已经研究了单轴拉伸下的杨氏模量和与材料横截面共面的力相关的剪切模量。.
剪切模量在普通的拉伸/压缩应力-应变曲线中是看不到的。.
它不是通过扭转或直接剪切载荷实验中测得的,而是通过剪切应力-应变曲线来测量的。.
体积模量:
另一个重要的弹性常数是体积模量,它描述了材料对体积变化的响应。体积模量定义为静水应力与相对体积应变之比:
$K = -\frac{P}{\Delta V / V}$
在哪里 P 施加压力和 ${\Delta V / V}$ 是体积应变,计算方法是体积变化量除以原始体积。.
体积模量与单轴应力-应变曲线没有直接关系,而是在静水压缩条件下测定的。体积模量:需要进行静水压缩实验,且无法在典型的应力-应变曲线中直接观察到。.
泊松比:
泊松比是材料的基本属性,它描述了材料在垂直于外力方向上的形变情况。当材料在一个方向上被拉伸时,通常会在另外两个垂直方向上收缩。泊松比正是量化这种形变行为的指标。.
从数学角度来说,泊松比(ν)定义为横向应变与轴向应变之比的负值:
$\nu = -\frac{Lateral \ strain}{Axial \ strain}$
这个比值可以帮助工程师预测材料在应力作用下的行为,尤其是在形状变化方面。例如,如果材料沿其长度方向受到拉力,其直径会减小——泊松比可以告诉我们减小的幅度。.
金属的典型泊松比约为0.3,这意味着当材料被拉伸时,其横向收缩量约为轴向伸长量的30%。泊松比为0.5的材料被认为是不可压缩的,因为它们的体积在形变过程中几乎保持不变。.
该特性在材料科学、结构工程和生物力学等领域至关重要,因为它影响着从设计到材料在各种载荷条件下的性能等方方面面。.
对于各向同性材料,杨氏模量、剪切模量和体积模量之间存在泊松比(ν)的联系。.
$E = 2G(1 + \nu)$
$E = 3K(1 – 2\nu)$
Determining Yield Strength: The 0.2% Offset Method Explained
0.2% 偏移法是一种确定没有明确屈服点的材料(例如许多金属和合金)屈服强度的方法。.
在某些材料中,弹性变形到塑性变形的过渡是渐进的,因此很难精确确定塑性变形的起始点。如图 4 所示,绘制一条与应力-应变曲线初始线性(弹性)部分平行的直线,起始应变值为 0.21TP³T(十进制为 0.002)。该偏移线与应力-应变曲线的交点即为屈服强度。.
简单来说:
-
屈服点 是 地点 屈服的开始。.
-
屈服强度 是 价值 当时压力很大。.
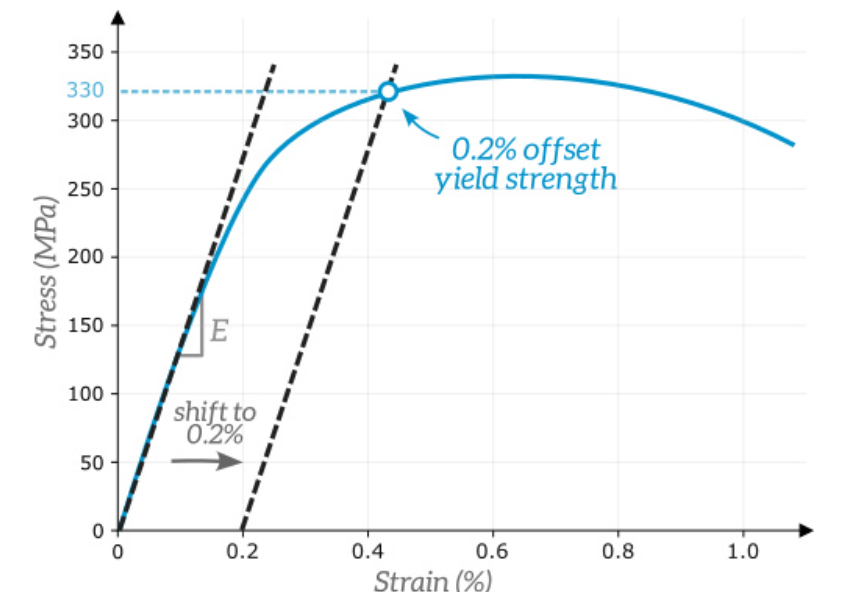
图 4:使用 0.2% 偏移法确定材料的屈服强度 [参考]
分步指南:如何应用 0.2% 偏移法
简要说明:
-
为什么是 0.2%? 它是行业标准——既小巧实用,又大到可以测量。.
-
适用于没有明显屈服点的材料, 例如铝或不锈钢。.
-
这种方法在设计、安全计算和材料比较方面特别有用。.
Engineering VS True Stress Strain Curve
工程应力-应变曲线定义:
应力和应变是根据试件的初始横截面积和初始长度计算的。.
- 工程应力:
$\sigma_{engineering} = \frac{F}{A_0}$
在哪里 F 是施加的力, 一个0 是初始横截面积。.
- 工程应变:
$\epsilon_{engineering} = \frac{\Delta L}{L_0}$
Where $\Delta L$ is the change in length, and $L_0$ is the initial length.
真实应力-应变曲线定义:
应力和应变是根据试样变形过程中的瞬时横截面积和瞬时长度计算得出的。这种方法能够更准确地表征材料行为,尤其是在大应变情况下。它对于理解塑性变形、颈缩和成形过程中的材料行为至关重要。.
- 真实压力:
$\sigma_{true} = \frac{F}{A_{instantaneous}}$
- 真实菌株:
$\epsilon_{true} = Ln(1 + \epsilon_{engineering})$
Key differences between the engineering stress strain curve and the true stress strain curve:
Hardness and Toughness
现在我们来定义硬度和韧性。韧性是指材料吸收能量直至断裂的能力。能够吸收大量能量而不发生断裂的材料被认为具有高韧性。.
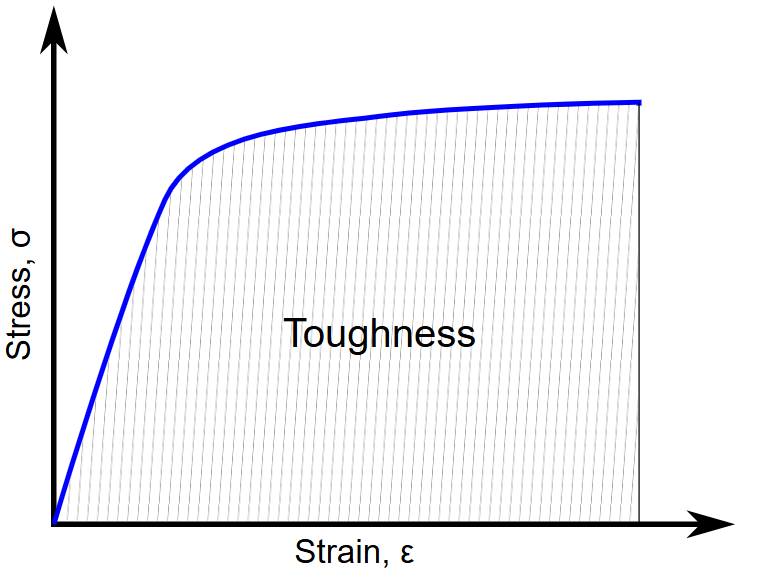
图 5:应力应变曲线中的韧性可视化 [参考]
韧性可以看作是应力-应变曲线下的面积,如图 5 所示。面积越大,韧性越强,材料在断裂前能够吸收大量的能量。.
要获得高韧性,材料必须兼具高强度和高延展性,而强度低且脆的材料通常韧性也低。.
当我们形容一个人具有韧性时,我们指的是他能够从变故中恢复过来,并保持其固有的个性。类似地,材料的韧性可以定义为它们吸收能量并恢复到原始形态的能力。换句话说,韧性定义了材料在弹性形变过程中吸收能量的能力(见图6)。.
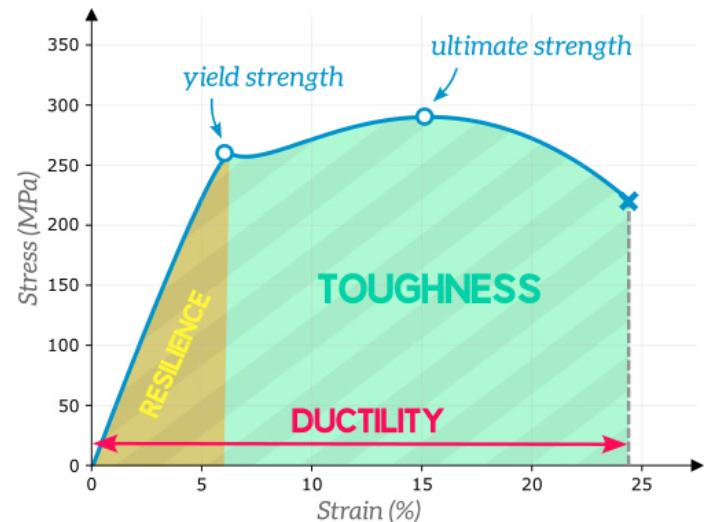
图 6:应力应变曲线中的弹性可视化 [参考]
韧性是一种整体性质,而硬度是一种表面性质。硬度是指抵抗刮擦、磨损和侵蚀的能力,而韧性则与抗断裂性、抗压强度和延伸率有关。.
Strain Hardening and Work Hardening
加工硬化和应变硬化是同一回事。. 应变硬化是提高合金强度最常用的方法之一。它是指利用永久变形来提高金属强度。.
加工硬化,通常也称为应变硬化,是指材料在经历塑性(永久)变形后强度增强的现象(见图7)。之所以称为冷加工,是因为塑性变形必须在足够低的温度下进行,以防止原子重排。这种特性对于金属尤为重要,因为金属在经历显著应变后会变得更难进一步变形。了解应变硬化有助于工程师设计能够承受重复载荷的材料。.
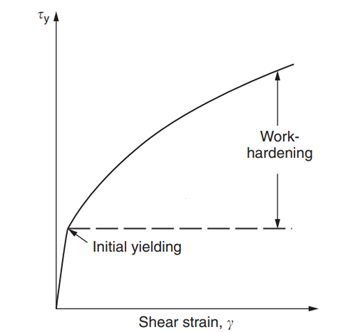
图 7:应力-应变曲线中的加工硬化

Key differences in hardness and toughness, and hardening:
Ductile VS Brittle stress strain curves
- 延展性材料: 对于金属等延性材料,其应力-应变曲线在弹性区域通常呈线性,随后进入明显的塑性区域。这意味着材料的变形量与所受力成正比,且具有可预测性。这类材料在失效前能够承受较大的变形,因此非常适合需要吸收载荷而不立即断裂的结构。.
- 脆性材料: 相比之下,陶瓷等脆性材料的应力-应变曲线呈非线性。脆性材料在断裂前几乎不发生塑性变形。这些材料在断裂前变形量很小,这意味着它们在应力作用下的容错性较差。它们更容易在几乎没有预兆的情况下突然失效,因此不适用于需要延展性的应用。.
图 8 显示了柔性材料和脆性材料的应力-应变曲线之间的差异。.
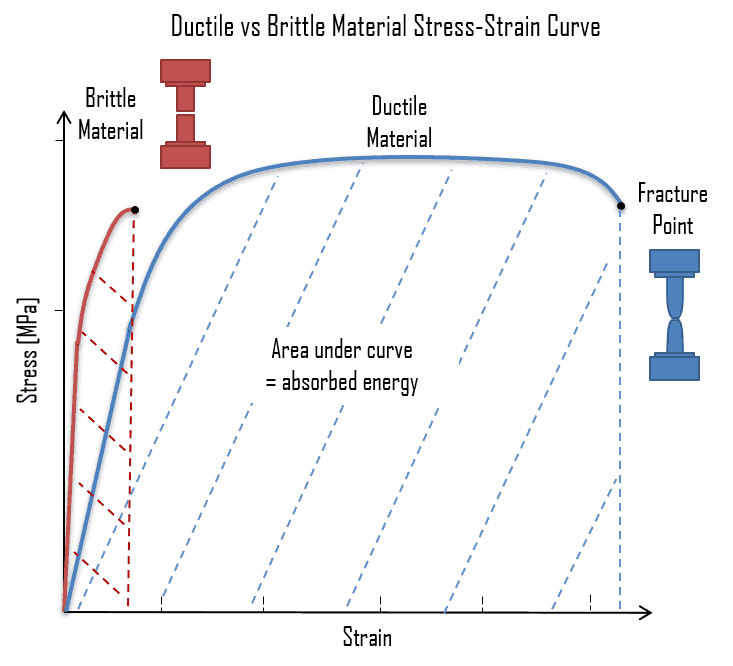
图 8:韧性和脆性材料的应力-应变曲线 [关于f]
Residual Stresses and Their Impact on the Stress–Strain Curve
In real engineering components, the stress state of a material is rarely zero before external loads are applied. Residual stresses are self-equilibrated stresses that remain locked inside a material after manufacturing processes such as welding, machining, heat treatment, cold working, or additive manufacturing. These stresses exist without any external force and play a crucial role in how a material responds during mechanical loading.

Figure 9 :Residual stress stress-strain curve [参考]
1. Effect on the Stress–Strain Curve
Residual stresses effectively modify the initial stress state of a material before loading begins. As a result, the measured stress–strain curve may differ from the intrinsic material response. Tensile residual stresses can cause apparent early yielding, reducing the observed yield strength, while compressive residual stresses may delay yielding and increase the apparent elastic range. Importantly, the material itself has not changed only the starting point on the stress–strain path has shifted due to internal stresses.
This explains why two specimens made of the same material but processed differently may exhibit noticeably different stress–strain responses.
2. Loading and Unloading Path: Non-Zero Residual Strain
When a material undergoes plastic deformation and is subsequently unloaded, it does not return to zero strain. The remaining deformation is known as residual strain, which is directly linked to residual stresses. The loading–unloading path on the stress–strain curve forms a hysteresis loop, clearly demonstrating that strain recovery is incomplete once plasticity occurs. This behavior is essential for understanding forming processes, springback in sheet metal forming, and dimensional inaccuracies in manufactured parts.
3. Why Residual Stress Matters in Engineering Analysis
Ignoring residual stresses can lead to inaccurate predictions of yield, fatigue life, and failure. In finite element analysis (FEA), residual stresses are often introduced as initial stress or strain fields to more realistically simulate behavior. Understanding how residual stresses influence the stress–strain curve bridges the gap between ideal material testing and actual structural performance.
Different Materials, Different Curves: Metal, Polymer, and Ceramic
Metals, polymers, and ceramics each exhibit different types of stress-strain curves. Metals typically show a clear elastic region followed by plastic deformation. Polymers, however, may exhibit more complex behavior, often showing a significant amount of elasticity before yielding. Ceramics, being more brittle, tend to have a steep, non-linear curve, with a sharp fracture point (See figure 10).
Figure 11 shows the difference in the toughness of these materials.
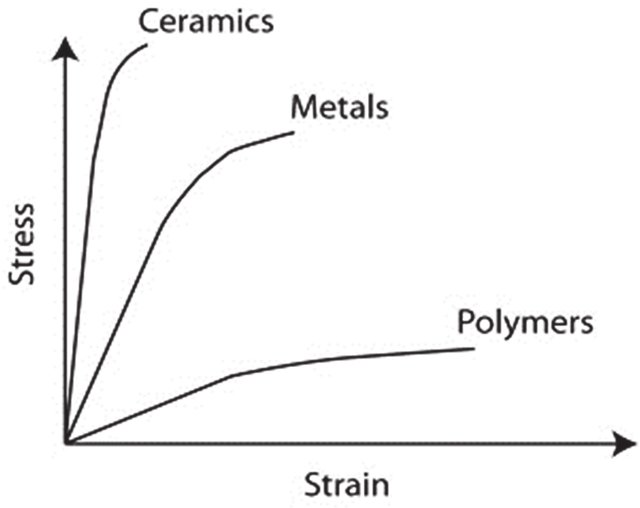
Figure 10: Typical Stress-strain Curve for the three classes of materials [参考]
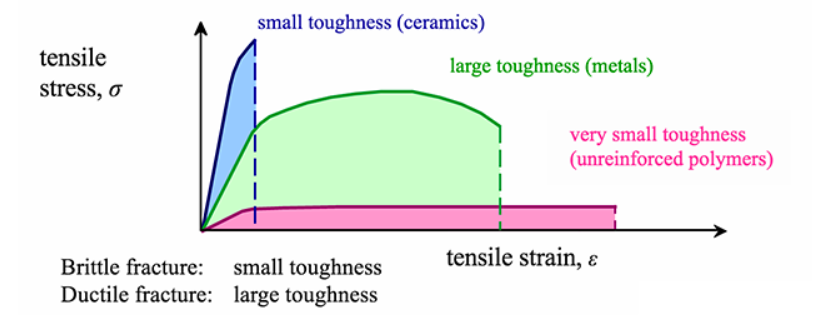
Figure 11: Comparison of toughness for the three classes of materials [参考]
了解材料的应力-应变曲线至关重要,因为每条曲线都对应着一个特定的材料模型。在 Abaqus 等有限元分析软件中精确模拟这些行为对于获得可靠的仿真结果至关重要。幸运的是,Abaqus 拥有一个全面的材料模型库,您可以在我们的博客上详细了解所有这些模型。, “关于Abaqus材质模型的一切.”
The Role of Temperature and Strain Rate on the Curve
温度和应变速率会显著影响应力-应变曲线。例如,在较高温度下,金属的延展性可能增强;而在较低温度下,金属则可能变脆。同样,施加应力的速率也会影响材料的力学行为,进而影响材料在实际工况下的性能。.
How to conduct a stress strain test: A step by step guide
应力-应变试验用于了解材料在应力作用下的行为。最常见的应力-应变试验类型包括:
- 拉伸试验: This test involves applying a pulling force to a material until it stretches and eventually breaks. It is used to determine the material’s tensile strength, yield strength, and ductility. It is necessary to produce test samples and then use the tensile testing machine as shown in figures 12 and 13.
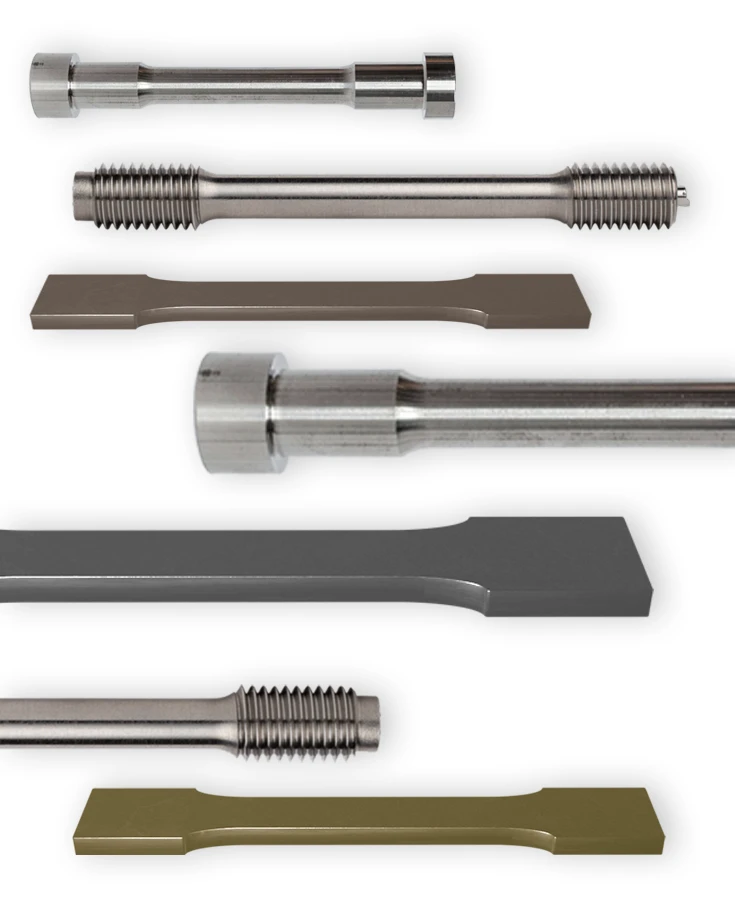
Figure 12: Tensile test sample [参考]
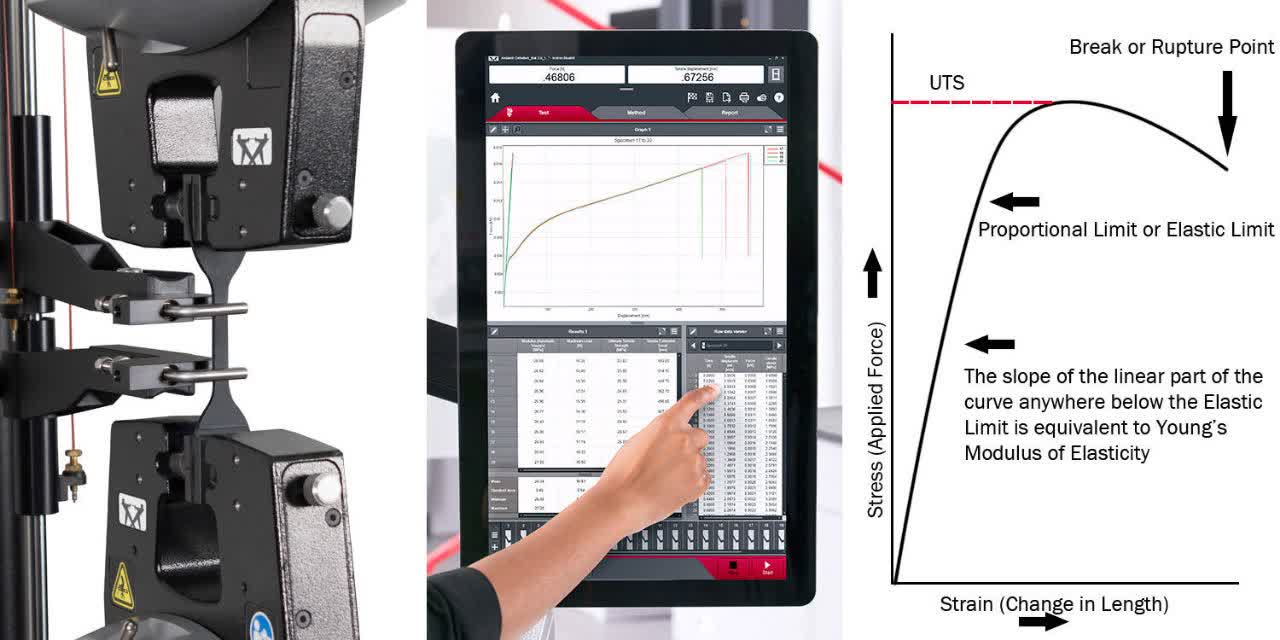
Figure 13: Tensile test device [参考]
- 压缩试验: 这项测试通过沿材料长度方向施加压缩力来对其进行压缩。它有助于确定材料对压缩力的反应,对混凝土等材料非常有用。.
- 剪切试验: 剪切试验用于测量材料对剪切应力的响应,剪切应力是指当力平行于材料表面施加时产生的应力。.
测试准备:所需设备
进行应力应变测试通常需要以下设备:
- 试验机:一种万能试验机(UTM),可以施加拉伸力或压缩力并测量变形。.
- 引伸计:一种用于测量测试过程中样品变形或应变的装置。.
- 试样:被测材料的标准样品,通常为圆柱形或矩形试样。.
- 测试装置包括将试样固定到机器夹具上,并确保对准正确,以避免读数不准确。测试机的校准对于确保力和形变测量的精确性至关重要。.
理解数据并绘制应力-应变曲线
测试完成后,数据以力-位移关系记录,然后转换为应力-应变关系。最终得到一条应力-应变曲线,该曲线展示了材料在载荷作用下的力学行为。该曲线能够揭示材料的弹性和塑性区域、屈服强度、极限抗拉强度以及失效点。.
Stress Strain curve: Real world applications and examples
结构工程中的应力-应变曲线
在结构工程中,应力-应变曲线用于预测材料在实际结构中承受各种力时的性能。该曲线帮助工程师为结构的不同部分选择合适的材料,确保结构能够承受必要的荷载而不发生破坏。例如,该曲线可以指示桥梁所需的钢材类型或建筑地基所需的混凝土配比。.
该曲线还有助于确保结构具有足够的安全裕度。通过了解材料的极限抗拉强度和屈服强度,工程师可以设计出性能远超极限的部件,从而避免灾难性故障。.
在航空航天和汽车行业的应用
在航空航天领域,应力-应变曲线对于选择能够承受极端条件的轻质高强度材料至关重要。飞机部件必须承受高拉力和应力的快速变化,因此,钛合金和铝合金等材料通常因其优异的应力-应变特性而被选中。.
同样,在汽车工程中,了解材料的应力-应变曲线可以确保汽车车架和部件在碰撞条件下既安全又耐用。材料必须足够坚固,能够吸收冲击力而不伤害乘客,同时也要足够轻,以确保燃油效率。.
应力-应变曲线如何影响消费品
应力-应变曲线不仅对大型工程项目至关重要,它也是智能手机、家具和包装等消费品的关键因素。这些产品所使用的材料必须在耐用性和成本效益之间取得平衡。例如,应力-应变曲线有助于确定智能手机屏幕的强度和柔韧性,确保其能够承受冲击而不轻易破碎。.
Stress-Strain Graph in ABAQUS
Common Misunderstandings about the Stress-Strain Curve
为什么有些材料的应力-应变曲线不符合简单的规律?
并非所有材料都表现出简单的线性应力-应变行为。有些材料,例如某些聚合物或复合材料,由于分子结构、温度敏感性或加载速率等因素,会表现出更复杂的行为。.
These materials may exhibit non-linear stress-strain curves or even unique failure modes that don’t align with the typical expectations of ductile or brittle materials. Figure 14 shows a stress strain curve for a composite material with different percentages of reinforcing filler (Date palm waste (DPW)) in a polypropylene matrix (PP). It can be found that the difference in the reinforcing changes the stress strain curve.
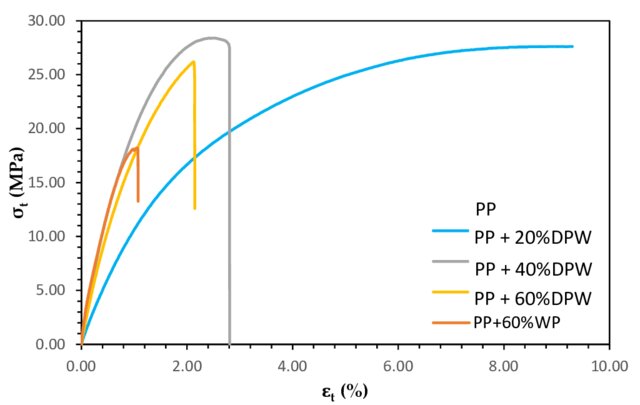
Figure 14: Stress–strain curves of composite materials with different percentages of reinforcing filler [参考]
事实与谬误:揭穿常见误解
关于应力-应变曲线存在一些误解,例如,有些人认为极限抗拉强度越高,材料性能越好。然而,高强度材料未必适用于所有应用。必须综合考虑应力-应变曲线,包括延展性和韧性,才能确保材料在特定应用中满足性能要求。.
结论
作为一名机械工程师,在了解了类似本文这样的基本概念后,我强烈建议您阅读关于“人工智能在机械工程中的应用“。”.
本文探讨了应力-应变曲线。我们讨论了关键主题,包括应力-应变曲线的参数以及与不同材料特性相关的不同类型的应力-应变曲线。文中还讨论了如何利用0.2%偏移法从应力-应变曲线确定屈服强度。此外,还介绍了应力和应变的类型,包括工程应力-应变曲线和真实应力-应变曲线。通过本文,我们了解到应力-应变曲线是材料科学和工程设计中的基础工具。通过了解材料在应力作用下的行为,工程师可以选择合适的材料,预测材料失效,并设计安全可靠的产品。应力-应变曲线在确保各种工程项目的成功方面发挥着至关重要的作用。.
Stress Strain Curves FAQs
1. What is the difference between stress and strain?
Stress is defined as the internal force applied per unit area of a material (measured in Pascals), whereas strain is the dimensionless measure of the resulting deformation. Together, they describe how a material resists or yields to external loading conditions.
2. How does Hooke’s Law apply to material stress and strain?
Hooke’s Law states that within the elastic limit, stress is directly proportional to strain, creating a straight line on the graph. The slope of this linear relationship is known as Young’s Modulus, which serves as a primary measure of a material’s stiffness.
3. What happens at the yield point of a stress-strain curve?
The yield point marks the critical transition where a material moves from elastic behavior to plastic behavior. Once the stress exceeds this point, the material will no longer return to its original form and begins to undergo permanent deformation.
4. What is the 0.2% offset method used for in engineering?
This method is used to determine the yield strength of materials that do not show a clear, distinct yield point on the curve. Engineers draw a line parallel to the elastic region starting at 0.002 strain; the point where this line intersects the curve is defined as the yield strength.
5. How can you identify a brittle vs. a ductile material from a graph?
Ductile materials show a long plastic region with significant deformation and necking before they eventually break. Brittle materials, such as glass or ceramics, exhibit almost no plastic deformation and fracture suddenly very shortly after reaching their elastic limit.
6. How do you identify the elastic region of stress strain curve behavior?
The elastic region is the initial, linear portion of the graph where the material deforms under load but returns to its original shape once the stress is removed. It is characterized by a constant ratio between stress and strain, which allows for the calculation of the material’s stiffness.
7. What happens when a material enters the plastic region of stress strain curve graphs?
Once a material enters the plastic region, it undergoes permanent, non-reversible deformation because the applied stress has exceeded the yield point. Even after the load is completely removed, the material will retain a permanent change in its physical dimensions or “set.”


2 回复
Great guide.We mostly see engineering curves in class. Why go through the extra work for ‘True’ stress in a simulation?
Glad you liked it! That is a great question. Engineering curves work fine for small stretches, but once you hit massive deformations—like in forming—they lose accuracy fast. True stress tracks the actual, shrinking area of the metal in real-time, which is why simulations need it to stay realistic. If you used engineering data there, your results would be way off!